


Fifty years after they entered the mainstream, fractals are reshaping how researchers think about shape, growth, and complexity. From computer graphics to medical imaging, the self-similar patterns first systematized in the 1970s have moved from theory to practice, changing tools across science and engineering.
“Over the last 50 years, fractals have challenged ideas about geometry and pushed math, science and technology into unexpected areas.”
The idea took hold in universities and labs, then spread to industries hungry for better models of roughness and irregular form. The result is a quiet shift in how we measure coasts, model lungs, compress images, and design antennas. That shift still stirs debate about what fractals explain and where they fall short.
The Long Arc Of A New Geometry
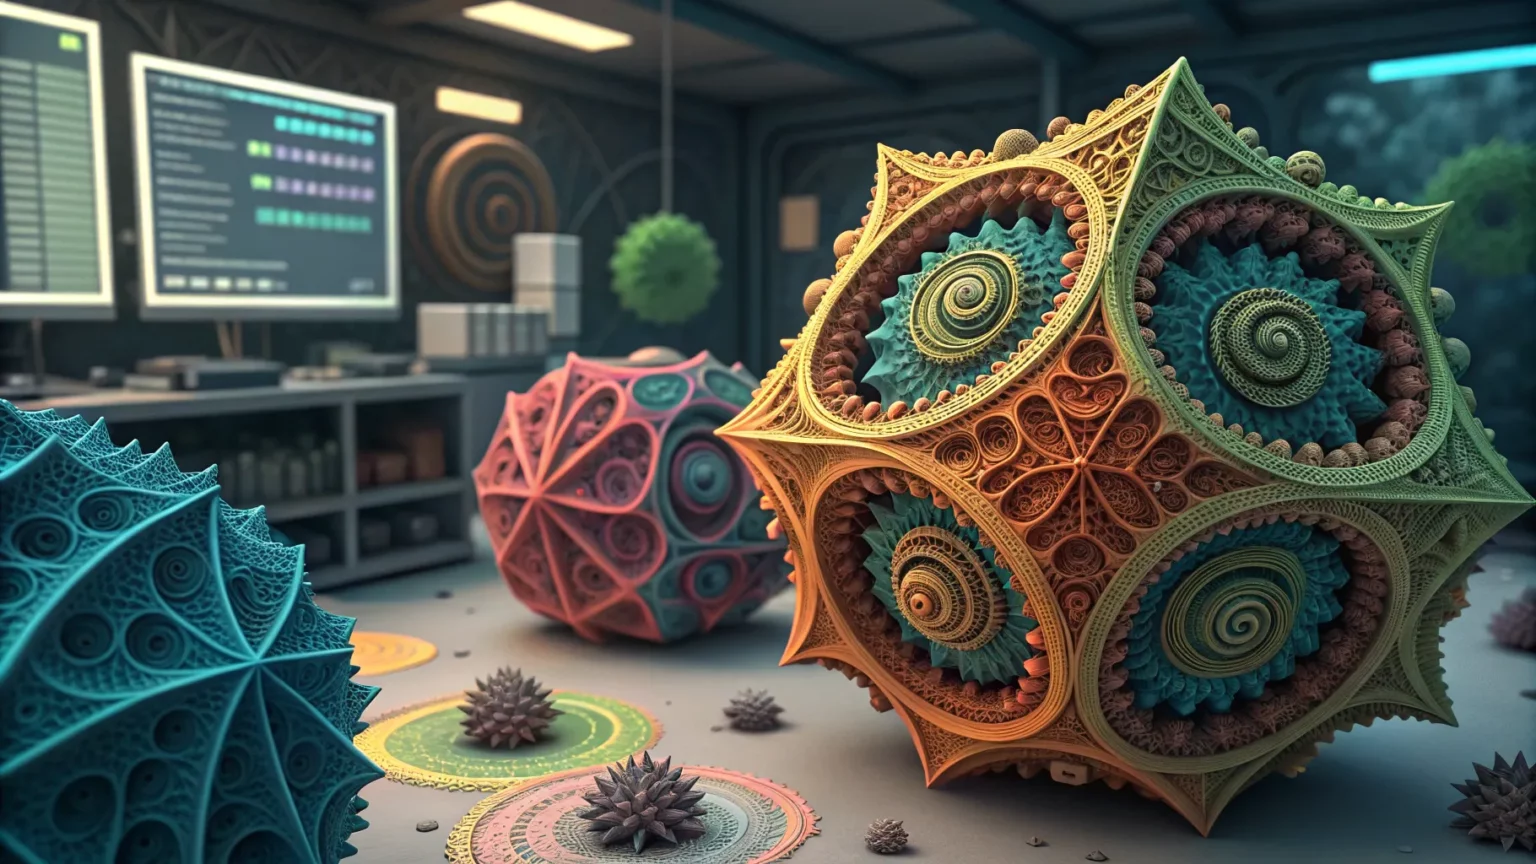
French-Polish mathematician Benoit Mandelbrot popularized the word “fractal” in 1975. He argued that many natural forms resist smooth Euclidean rules. Coastlines lengthen as you zoom in. Clouds keep their texture across scales. Trees branch with striking regularity.
The public saw the idea through vivid sets plotted on early computers. The Mandelbrot set, first widely drawn in 1980, became an icon of science culture. It also showed that simple formulas can produce intricate patterns.
By the late 1980s and 1990s, researchers used fractal geometry to measure roughness and build better simulations. The approach let scientists assign numbers, like fractal dimension, to describe irregular shapes. That made comparisons and modeling easier.
From Screens To Systems
Fractals soon left the math seminar and entered daily tools. Computer graphics used them to render believable terrain, smoke, and textures. Telecommunications engineers explored fractal antennas with compact shapes and wide frequency ranges. Doctors and biologists studied branching networks in lungs and blood vessels using fractal measures.
- Signal engineers used fractal patterns to design compact, multi-band antennas.
- Medical teams measured tumor edges and vessel trees to track disease.
- Earth scientists analyzed coastlines, river basins, and fault lines for risk models.
- Coders improved image compression and noise reduction with fractal-inspired methods.
“The strength is scale,” said one engineer at a recent conference. “If a pattern repeats at many sizes, a single rule can describe a lot.” That logic helps when data are messy and detail never seems to end.
Promise And Limits
Interest rose in finance as well. Researchers studied heavy tails in price moves and long memory in volatility. Some pointed to fractal models to explain bursts and clusters in markets. Others were wary. A model can match past data yet still fail in real time.


Climate and weather studies also adopted fractal metrics for clouds and rainfall. The measures helped describe structure. But process models still need physics and chemistry to predict change. Fractals help with shape, not cause.
Critics warn against forcing every rough pattern into a single story. “Self-similarity is common, not universal,” said a climatologist who uses the tools. The method works best as part of a broader kit, not a stand-alone fix.
What The Data Say
Across fields, teams report gains when fractal ideas meet domain knowledge. In imaging, studies link higher fractal dimensions at tumor margins with aggressive growth. In networks, traffic shows scale patterns that inform routing and capacity plans. In materials, fracture surfaces show repeatable measures that guide testing.
These cases share a theme. Fractal measures translate rough form into numbers. Those numbers guide design, diagnosis, and control. But the step from number to cause needs more work and must be paired with field-specific theory.
The Road Ahead
Researchers now apply fractal concepts to sensors, energy grids, and even wildfire spread. AI teams study multiscale features and self-similarity in training data and model outputs. Toolkits mix fractal metrics with machine learning, yielding quicker analysis of complex imagery.
Education is also changing. More schools introduce fractals in early math and coding classes. The visuals make abstract ideas feel concrete. That helps students link formulas to the real world.
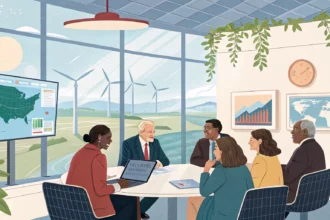
Policy groups track these shifts, since models guide real decisions. Risk teams want methods that are clear, testable, and fair. Clear reporting of fractal metrics, limits, and assumptions is gaining ground.
Fractals began as a new way to see shape. They are now part of how engineers design devices, how doctors read scans, and how scientists measure roughness in nature. The next gains will likely come from careful pairing of fractal measures with domain models and data.
As research pushes on, one point holds. Irregular forms are not noise to ignore. They are patterns to measure and, when used wisely, tools that improve how systems work.